Motorsport Engineering student developing practical capability across performance analysis, vehicle modelling, CAD, manufacturing and mechatronics. Projects focus on defining the engineering requirement, identifying the available information and constraints, and selecting methods appropriate to the required accuracy, evidence and application. Motorsport is the primary application area, alongside broader engineering problem-solving and systems integration.
PA · PERFORMANCE ANALYSIS
Telemetry & performance
Using limited telemetry to identify performance differences, define useful questions and support engineering interpretation.
RacingLineTelemetry analysis environment
Live / Strategy DashLive race-state & strategy awareness
VD · VEHICLE DEVELOPMENT
Dynamics & aerodynamics
Using vehicle models and first-order requirement studies to connect circuit demands with vehicle behaviour and design decisions.
Lap-Time SimulatorVehicle dynamics · model development
A telemetry-analysis environment for investigating driver behaviour and lap-performance differences using publicly available Formula 1 data. The workflow moves from an observed question to base telemetry, targeted derived analysis and a supported interpretation.
APPLICATION / PERFORMANCE ANALYSISSTATUS / ACTIVE DEVELOPMENTDATA / FASTF1 PUBLIC TELEMETRYROLE / ANALYSIS LOGIC + WORKFLOW DESIGN
RacingLine provides a practical environment for performance-analysis practice using public Formula 1 telemetry. It is designed to support engineering questions, test what the available channels can justify, and add new analytical representations only when conventional traces are insufficient.
Investigations may begin with behaviour observed during Formula 1 sessions, a comparison raised during broadcast coverage, or a difference visible in the base traces. Derived analysis is then added around that specific question rather than treated as an objective in itself.
ANALYSIS WORKFLOW
01Observe / question
02Read the base traces
03Add relevant analysis
04Develop or challenge a hypothesis
COMPARE / FIND THE DIFFERENCE
Compare mode establishes where two laps or drivers differ before deeper analysis is introduced. The view is deliberately restrained because the base traces and a small number of derived metrics already create several simultaneous information states.
SINGLE / REDUCE THE PROBLEM
When a difference requires closer investigation, Single mode isolates one lap so phases can be examined with overlays and rearranged channel traces. This provides greater analytical depth without duplicating every derived output across two drivers.
INFORMATION DENSITY / INTERFACE LOGIC
ACCESS IS NOT THE SAME AS ATTENTION
Displaying every channel at equal priority makes detailed comparison harder. The channel layout is therefore stacked and movable so the full dataset remains accessible while only the relevant relationship is given visual priority.
PROGRESSIVE OVERLAYS
Derived overlays are activated when they are relevant to the current question rather than left permanently visible. The interface is arranged to support focused engineering investigation rather than to maximise the amount of information shown at once.
SUPERCLIP / REVISING THE INFERENCE
THE FIRST ASSUMPTION
The early SuperClip method treated a full-throttle zone as one analysis region: find its peak speed, compare it with the end speed, and flag a decline. At Spa this produced an unusually long zone around Eau Rouge, Raidillon and Kemmel even though the underlying speed profiles looked plausible.
Review of earlier Spa telemetry showed the same broad speed-loss-and-recovery behaviour through the complex. The problem therefore became physical rather than numerical: full throttle did not necessarily imply continued longitudinal acceleration.
THE PHYSICS CHANGED THE METHOD
Through Eau Rouge and Raidillon, tyre capability is redirected from predominantly longitudinal acceleration toward substantial lateral demand. Full throttle combined with speed loss was therefore not sufficient evidence for the behaviour that SuperClip was intended to identify.
A delta-heading representation was introduced to provide geometric context. Curvature was less useful for this purpose because the required information was the progression of directional change and a practical corner-versus-straight state, not a noisy instantaneous radius-like quantity.
AFull-throttle parent zone
BCorner / straight context
CSegment gating
DIndependent plausible clip regions
That correction exposed another assumption: one continuous full-throttle zone can contain more than one plausible clipping event. At Spa, for example, an event can occur after La Source and another on Kemmel while the throttle remains within the same overall FT zone. The current structure therefore uses corner/straight context and segment gating to create separate regions in which the SuperClip inference is physically plausible, rather than assigning one event to the parent zone.
LICO / STRONGER INFERENCE, NOT GROUND TRUTH
Lift-and-Coast analysis developed from the same practical problem: manually coordinating brake, throttle and surrounding traces was slow. Formalising the identification workflow made candidate behaviour easier to surface consistently while preserving distinctions between different forms of throttle reduction.
The visible analysis separates strict lift-and-coast, partial lift-and-coast, partial lift, power-trim and other or unknown behaviour. Complete windows can then be represented at a higher level, including strict and mixed cases.
Lift-and-Coast Detail is deliberately a single-driver tool. Its value comes from relating phases within one driver's lap; duplicating that depth for two drivers at once would add visual complexity without improving the underlying interpretation.
The output is treated as inference. Public telemetry does not expose the team's actual instruction or internal control state, so classifications are checked against the underlying traces and, where available, written or video evidence rather than presented as formally validated ground truth.
Exact thresholds, filters and classification logic are intentionally not published. The portfolio focuses on the engineering reasoning, assumptions and development path.
LIMITATIONS / CLAIM BOUNDARY
The dataset is incomplete. Public channels place a hard ceiling on what can be observed. RacingLine cannot manufacture internal vehicle states that were never measured.
The telemetry is context-agnostic. Similar signatures can arise from different run plans, traffic, tyres, fuel loads, instructions or operational objectives. Much of the required context currently comes from observing Formula 1 practice, qualifying and race sessions rather than from the application itself.
Several behaviours do not have a directly observable reference label in publicly available telemetry. Classifications are therefore treated as indicative and checked against the underlying traces and external evidence where available, rather than presented as definitive labels.
Further development must remain within the limits of the observable data. Delta-heading context may refine lift-and-coast analysis spatially, while acceleration profiles may expose useful dynamic phases or regular clipping signatures. Neither supports a claim about an unobservable energy-management state.
BUILDING THE TOOL / OWNERSHIP
The primary contribution is the engineering definition behind the metrics and workflow: defining the investigation, specifying what an inference should represent, identifying failure modes, and shaping the interface around interrogation rather than automation. Python and FastF1 implementation is extensively AI-assisted and is not presented as the main engineering contribution.
Methodology note. The derived metrics and classification methods shown in RacingLine are self-developed analytical tools for practice and exploration. They are not presented as established industry methods or definitive classifications, and should not be used as standalone evidence of driver intent, team instruction or internal vehicle state.
DIRECTION / CONNECTED PERFORMANCE WORKFLOW
RACINGLINE NOW
The public-data version is a working analysis environment for practising performance analysis with real Formula 1 session data without team-level telemetry or operational context.
DEVELOPMENT DIRECTION
The longer-term direction is support for real vehicle data, greater flexibility similar to established motorsport analysis environments such as MoTeC, and stronger links with simulation and other performance-engineering tools.
WHAT THIS PROJECT DEMONSTRATES
RacingLine is primarily an engineering-analysis project rather than a software product. Development has repeatedly required limits to be placed on inference, apparently sensible metrics to be challenged against vehicle behaviour, and information density to be controlled so that additional data does not automatically imply better understanding.
PA.02 · LIVE / STRATEGY DASH
Live / Strategy Dash
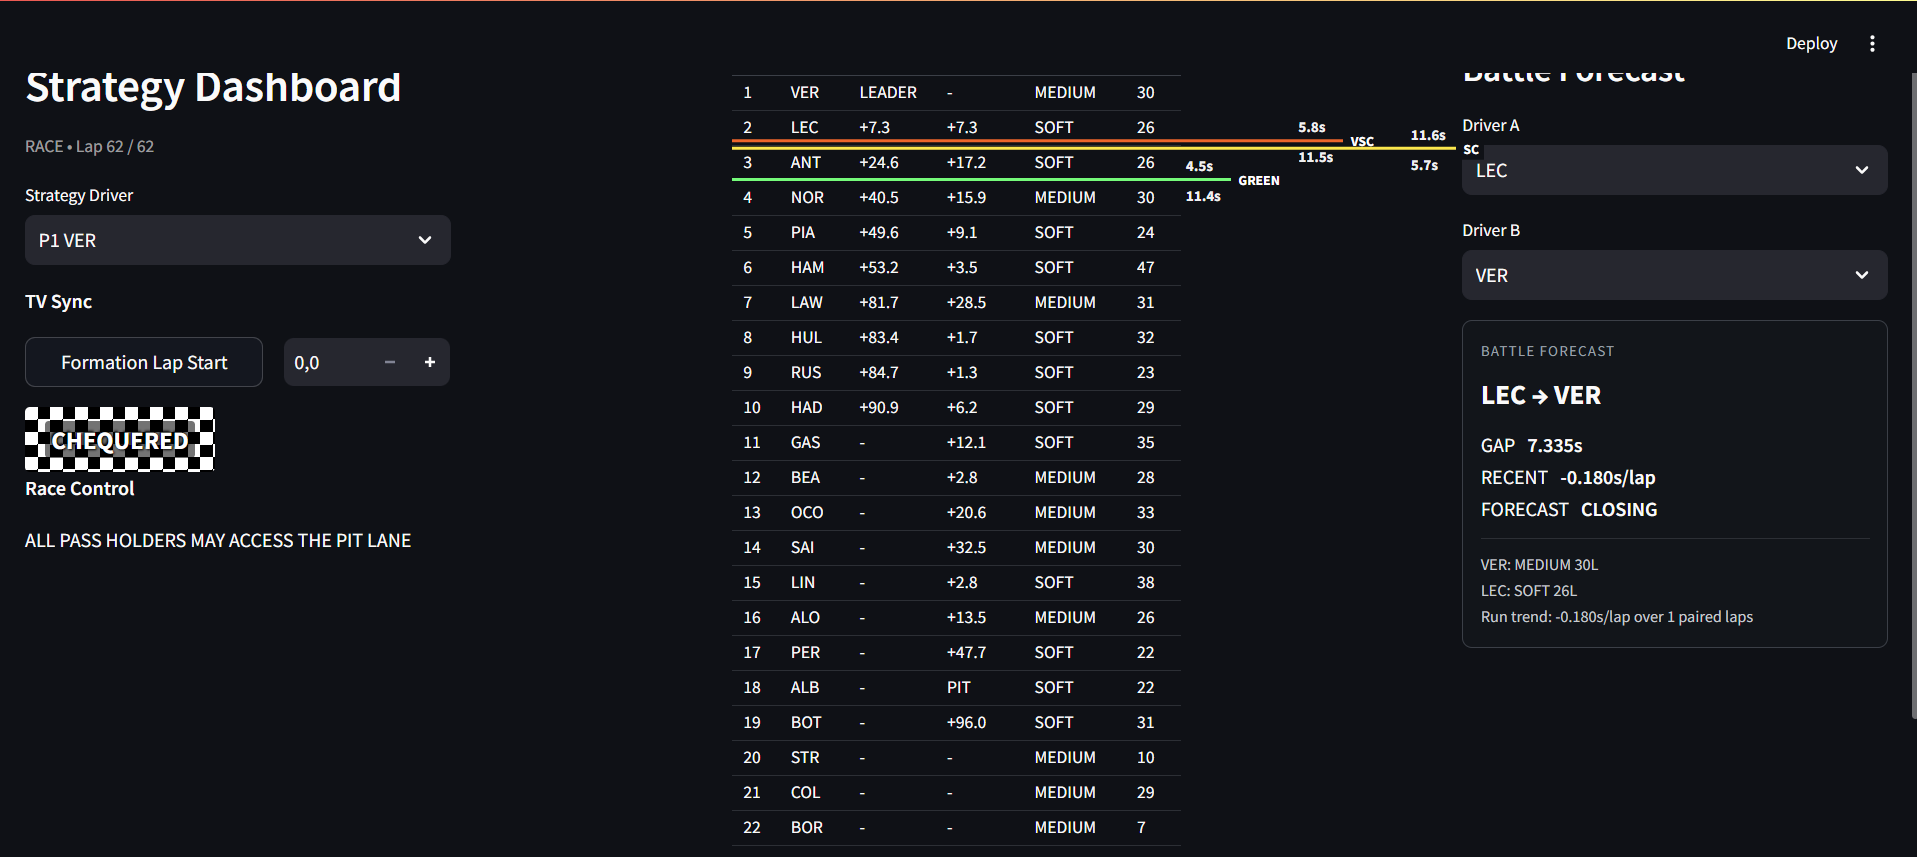
A live race-engineering workspace in development for monitoring session state, strategic context and selected on-track battles using publicly available Formula 1 data.
APPLICATION / LIVE RACE ENGINEERINGSTATUS / ACTIVE DEVELOPMENT & TESTINGIMPLEMENTATION / AI-ASSISTED PYTHON + STREAMLIT
01 / SESSION STATE
The Practice and Qualifying view keeps the basic session state visible while adding best lap, last lap, lap delta, current tyre compound and tyre age. These channels provide enough context to form a tentative view of a run without assuming knowledge of the team's programme.
02 / STRATEGIC AWARENESS
A selected-driver rejoin layer applies researched circuit-specific pit-loss estimates for green-flag running, Virtual Safety Car and Safety Car conditions to the current field gaps. It estimates where the car may rejoin the field; it is not presented as a pit-window or strategy recommendation model.
03 / BATTLE FORECAST
The current Battle Forecast estimates whether a selected pair is closing, stable or opening using the most recent paired valid laps, then estimates when the gap may reach approximately one second. The output is a relative-performance indicator rather than an overtaking probability.
The Dash is an approximation of a race-engineering workspace. It keeps the live session state visible and adds analytical layers where they help frame what may happen next. Publicly available data defines the boundary; the project is not intended to reproduce a team pit wall or infer information that is not available.
The design principle is to surface information and relationships that support engineering interpretation rather than automate it. Development therefore centres on defining a useful calculation, testing it against live race-session behaviour, and revising the logic when its assumptions fail.
MINISECTORS / SPATIAL CONTEXT
Why minisectors. Sector times are too coarse to show where a relative-performance difference develops. Minisectors provide finer localisation and act as the closest available proxy for lap progression when reliable continuous live position is unavailable.
Next use. Mapping minisectors to approximate circuit sections would add spatial context to the timing state. This could support phase-by-phase battle comparison and limited pit-exit traffic awareness without automatically assigning a vehicle-performance cause.
BATTLE FORECAST / CURRENT LOGIC
01 / DEFINEBattle is not simply a shrinking gap; the following driver must approach a range where meaningful competitive interaction can become feasible.
02 / MEASUREPair valid completed laps and use a rolling three-lap relative-performance mean as a responsive short-term estimate.
03 / PROJECTUse current gap and relative pace to estimate progression toward the ~1 s competitive region, while retaining longer clean-run context.
04 / TESTRun it live and log outputs; traffic and other context can make technically valid laps unrepresentative and expose failure in the projection.
LIVE VALIDATION
During Formula 1 race weekends, the Dash is run alongside independently observable broadcast, timing and race-control information. Positions, gaps, lap state, flags, messages, tyres and minisectors are checked against the live session, while logged tests preserve forecast states for later review rather than relying only on hindsight.
CURRENT FRONTIER
The nearer-term Battle Forecast direction is phase-wise relative performance using retained minisector information to show where the selected pair repeatedly gains and loses around the lap. Intervening traffic is a later problem because correcting for it introduces additional assumptions about battles and passing rather than a single defensible penalty.
INFORMATION HIERARCHY
The interface remains an engineering prototype rather than a finished user-experience design. Core session information is placed centrally, selected or higher-priority analysis to the right, and general context to the left, reflecting the viewing hierarchy used during live sessions.
The live-use constraint differs from post-session analysis because the session continues while the tool is being read. The minimum required state therefore remains continuously visible, while richer information is surfaced only when it is relevant.
LIMITATIONS & DEVELOPMENT
Accessible data
Public live data does not provide the operational context or reliable continuous position available to a team. Position-based experiments therefore remain exploratory rather than a solved capability.
Forecast context
A valid lap is not necessarily representative. Traffic, management and incidents can distort the recent relative pace even when the calculation itself is mathematically correct.
Broadcast synchronisation
Live validation must distinguish the data-feed state from the broadcast state. One Baku test showed approximately a 41-second alignment difference between Formula 1 TV coverage and the data feed.
Richer data only when useful
Additional feeds are considered only where they materially enable an analysis, particularly position-based work, rather than to increase dashboard content.
CONTRIBUTION / IMPLEMENTATION BOUNDARY
Project contribution centres on engineering and analytical definition: the questions the Dash should answer, calculation and metric logic, assumptions, information hierarchy, live testing, interpretation of failures and development priorities. Python and Streamlit implementation is AI-assisted; the application is not presented as evidence of independently authored software.
External inputs include accessible Formula 1 data streams and researched values such as circuit-specific pit-loss estimates. These inputs are separated from the analytical logic developed around them.
VD.01 · LAP-TIME SIMULATOR
Lap-Time Simulator
A developing quasi-steady vehicle-performance model used to apply vehicle-dynamics concepts, compare predicted behaviour with external reference data, and investigate the causes of disagreement.
The project provides a practical framework for developing vehicle-dynamics understanding in a race and performance engineering context. Each added concept is applied to the model, compared with reference behaviour, and revised where necessary.
02 / SOLVER
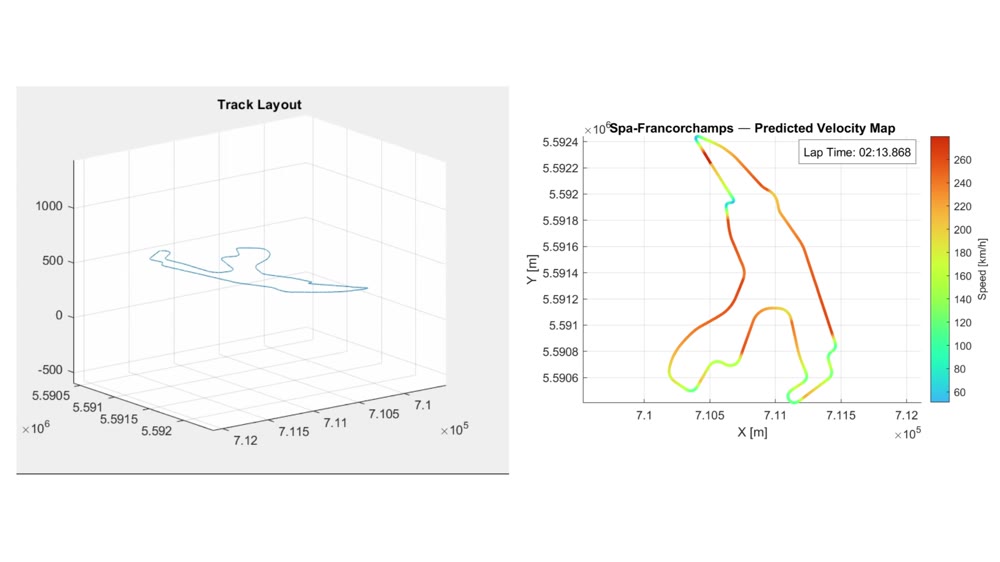
Track geometry feeds a local cornering-speed envelope; backward braking and forward acceleration passes then connect those local limits into a feasible spatial speed trace and integrated lap time.
03 / CURRENT QUESTION
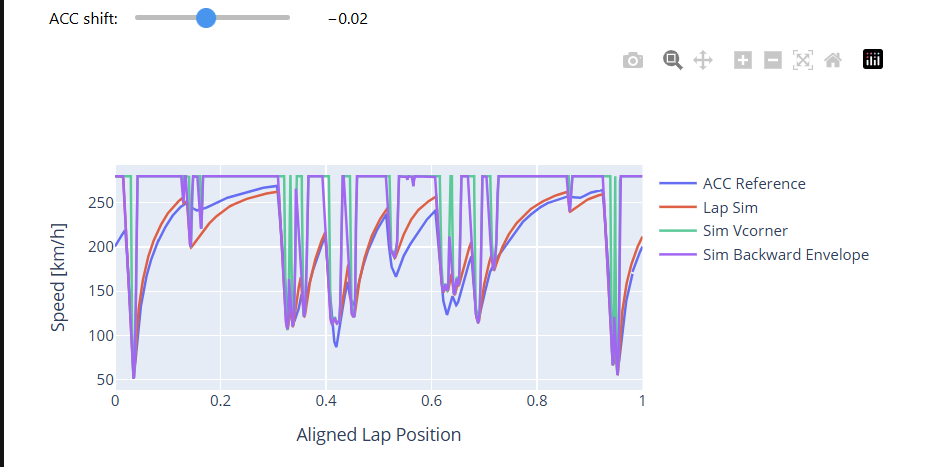
Current development is centred on understanding differences between the simulated speed trace and an Assetto Corsa Competizione telemetry reference viewed in MoTeC at Spa, particularly the simplified tyre representation and the implementation of track curvature and driven line.
TRACE COMPARISON / ACC REFERENCE VS LAP SIM · MANUAL SPATIAL OFFSETWORKFLOW / SPA SIMULATION AND REFERENCE-COMPARISON OVERVIEW
MODEL ARCHITECTURE / CURRENT BASELINE
01 / TRACKRepresent the circuit spatially and derive the geometry needed by the vehicle model, including curvature and gradient.
02 / ENVELOPEEstimate the local speed permitted by the current quasi-steady lateral-grip and aerodynamic assumptions.
03 / CONNECTPropagate braking backwards and acceleration forwards so the car can physically transition between local speed limits.
04 / INTERROGATECompare the resulting speed trace and lap time with reference behaviour, then investigate the physical source of local error.
WHY THE TRACE MATTERS
A plausible lap time is not enough to establish that the model is behaving correctly. Errors can cancel: a model can be too fast in one phase and too slow in another while still producing a convincing total time. The more useful question is therefore where the predicted speed trace agrees with the reference, where it diverges, and what part of the model could physically create that difference.
The project therefore uses differences in trace shape and regional speed trends as diagnostic evidence rather than relying on a headline lap-time number. A speed difference may come from the vehicle model, tyre assumptions, represented track curvature or driven line, imperfect dataset alignment, or several of these effects together.
CURRENT VALIDATION TOOL
An AI-assisted comparison tool overlays the simulated Spa speed trace with the Assetto Corsa Competizione reference viewed in MoTeC. Because the datasets do not share a sufficiently trustworthy spatial origin, a manual offset is used to bring them into broad correspondence.
WHAT IT CAN SUPPORT
The alignment is sufficient for broad trace-shape and performance-trend investigation, but not for claims about precise braking points, apex positions or metre-by-metre agreement.
PROGRESSIVE FIDELITY
Control model fidelity. The current point-mass model uses simplified tyre and traction assumptions so that their influence remains identifiable. Additional fidelity is introduced where comparison with reference data exposes a specific limitation that the next model layer is intended to address.
Current development direction. Tyre load sensitivity and combined longitudinal/lateral capability are natural next steps, while track/line representation must also be understood well enough that geometry error is not mistaken for vehicle-model error.
Tyres
The baseline friction representation is intentionally simplified and cannot yet reproduce the full load-sensitive, combined-slip behaviour of a real tyre.
Traction / powertrain
Acceleration still uses simplified whole-vehicle tractive-capacity assumptions rather than a fully resolved driven-axle and powertrain model.
Track representation
Curvature and the implemented line directly influence the predicted lateral speed limit; disagreement here can appear as vehicle-model error.
Validation alignment
The current manual trace alignment is useful for trends but deliberately not treated as precise spatial ground truth.
CONTRIBUTION / DEVELOPMENT BOUNDARY
Authorship is mixed. Vehicle-dynamics reasoning and modelling direction are combined with academic and self-directed learning, AI discussion, methodological guidance and AI-assisted implementation. Development starts from a physical interpretation, then uses discrepancies to identify what needs to be learned or revised next.
The Lap-Time Simulator is presented as evidence of an active vehicle-dynamics learning and modelling process, not as a claim of an independently authored or professionally validated simulation package.
DEVELOPMENT DIRECTION
NEAR TERM
Improve the credibility of the trace comparison, separate track/line effects from vehicle-model effects, and introduce additional tyre fidelity only where the current comparison shows a reason to do so.
LONGER TERM
Progress from the point-mass baseline toward more capable vehicle representations where they answer useful questions, and eventually connect predictive modelling with the observed-data analysis side of the wider performance-engineering toolchain.
VEHICLE DEVELOPMENT / SECONDARY STUDY
VD.02 · MONZA REAR-WING REQUIREMENT STUDY
Monza Rear-Wing Requirement Study
A first-order vehicle-development study linking estimated Monza corner demands to a rear-wing downforce requirement that could inform the wider group aerodynamic work.
What rear-wing load would be required by the circuit at representative corner speeds before the wider aerodynamic package was assessed?
02 / METHOD
Estimated corner radii and telemetry-derived minimum speeds were converted into lateral-force and vertical-load requirements. Vehicle weight was removed from the total vertical load, then 30% of the remaining aerodynamic requirement was assigned to the rear wing as a first-order assumption.
03 / OUTPUT
The calculation produced a corner-by-corner first-order rear-wing load requirement across 14 evaluated Monza segments, providing an input for the wider group aerodynamic study.
REQUIREMENT CHAIN
01 / CIRCUIT INPUTEstimate representative corner radius and minimum speed for each evaluated Monza segment.
02 / VEHICLE LOADUse the lateral-force requirement and an assumed tyre friction coefficient to estimate the required total vertical load.
03 / AERO ALLOCATIONSubtract vehicle weight to estimate aerodynamic load, then allocate a fixed proportion of that requirement to the rear wing.
04 / HAND-OFFProvide the circuit-specific rear-wing requirement as an input to the wider group aerodynamic development.
WHAT THE STUDY SUPPORTS
The value of the exercise is the requirement chain rather than the absolute aerodynamic numbers. It connects circuit geometry and observed vehicle speed to a vehicle-level load requirement before later aerodynamic development, rather than beginning from wing coefficients in isolation.
The calculation also makes its assumptions visible. Large or unexpected requirements can indicate either a demanding circuit condition or a limitation in the simplified vehicle, tyre, corner-radius or load-distribution assumptions.
Corner representation
Corner radii were estimated and the circuit was reduced to representative segments rather than modelled as a continuous driven line.
Tyre model
A constant friction coefficient of 1.7 was used, so tyre load sensitivity and combined-slip effects were not represented.
Aero distribution
The rear wing was assigned 30% of the calculated aerodynamic requirement as a fixed first-order assumption rather than from a full aerodynamic-balance model.
Quasi-steady scope
The calculation does not resolve transient balance, ride-height sensitivity, yaw, steering input or other effects that would influence the real vehicle requirement.
CONTRIBUTION / GROUP BOUNDARY
The contribution presented here is the first-sheet requirement study: circuit assumptions, force and downforce calculations, and rear-wing requirement derivation.
Candidate-wing assessment and the subsequent detailed DRS and airfoil development were carried out within the wider group project and are not presented here as personal work.
DM.01 · DESIGN & MANUFACTURING
Sand-Casting Development
A group manufacturing project developed from a supplied component reference. The work progressed from reconstructed final geometry to an as-cast definition, pattern, sand mould and core system that could be assembled, separated and manufactured.
The starting information was incomplete visual reference material rather than manufacturing geometry. The component was interpreted and scaled into a final CAD model, then worked backwards through the as-cast, pattern, mould and core states.
02 / PARTING LOGIC
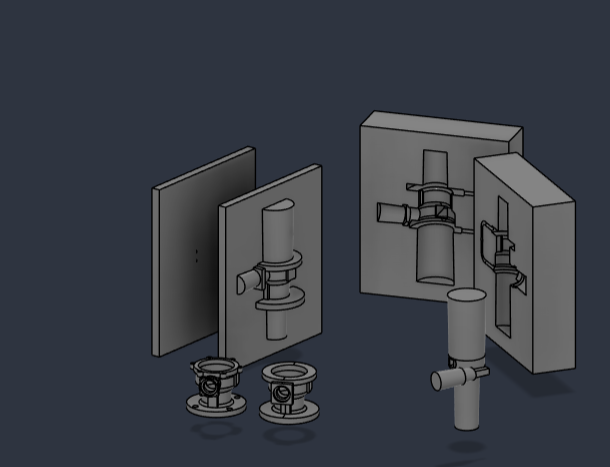
The body was oriented so the centre-lines of both principal fluid passages lay in the parting plane. One cope/drag split could therefore accommodate the dominant external geometry without creating an avoidable withdrawal problem around the side branch.
03 / DESIGN FOR WITHDRAWAL
Where final flange geometry conflicted with straightforward pattern withdrawal, material was added back to the as-cast definition and removed in a subsequent machining operation rather than complicating the mould around a local undercut.
MANUFACTURING CHAIN / WORKING BACKWARDS
01 / FINAL PARTReconstruct the component required after machining from the supplied visual and dimensional references.
02 / AS CASTRemove or fill features that are better created by machining and incorporate the allowances required by the selected casting route.
03 / CORES + PATTERNTurn the external and internal negative geometry into tooling that can itself be made, located and withdrawn.
04 / MOULDBring the pattern, core prints and group-developed pouring system together into a complete sand-mould concept.
PROCESS / INTERACTIVE CASTING SEQUENCECOPE · DRAG · CORE ASSEMBLY · AS-CAST · FINALDRAG TO ORBIT · SCROLL TO ZOOM · TIMELINE CONTROLS BELOW
CORE SOLUTION / SEQUENTIAL WITHDRAWAL
The branched internal passage created the key tooling problem. A core with the correct negative volume is not useful if it cannot be released from the tooling used to make it. The solution was therefore a deliberately sequenced two-piece core system rather than a monolithic branched shape.
The branch piece is withdrawn first along the branch direction. Removing it clears the geometric interlock, allowing the main core to withdraw along the primary passage axis. Core prints then locate the assembled core relative to the external mould cavity.
PARTING STRATEGY
Placing both passage centre-lines in the parting plane made the global mould split solve as many withdrawal problems as possible. Remaining conflicts could then be handled locally rather than forcing a more complicated overall mould architecture.
AS-CAST ≠ FINAL
The as-cast definition did not attempt to reproduce every final feature. Where machining provided a simpler manufacturing route, additional stock was retained in the casting and the final geometry was recovered later.
CONTRIBUTION / GROUP BOUNDARY
This was a group academic project. The contribution presented here covers component interpretation and reconstruction, CAD development, the as-cast transformation, pattern and mould geometry, and the core and core-tooling solution. Pouring-system development, including gating, runners, riser and venting, was primarily completed by other group members and integrated into the wider manufacturing package.
The project is presented as evidence of design-for-manufacture and geometric reasoning, not as production-foundry tooling. Process allowances and parameters were selected from researched casting guidance within the scope of the assignment rather than validated through a production casting programme.
DM.02 / MOTORSPORT CAD STUDY
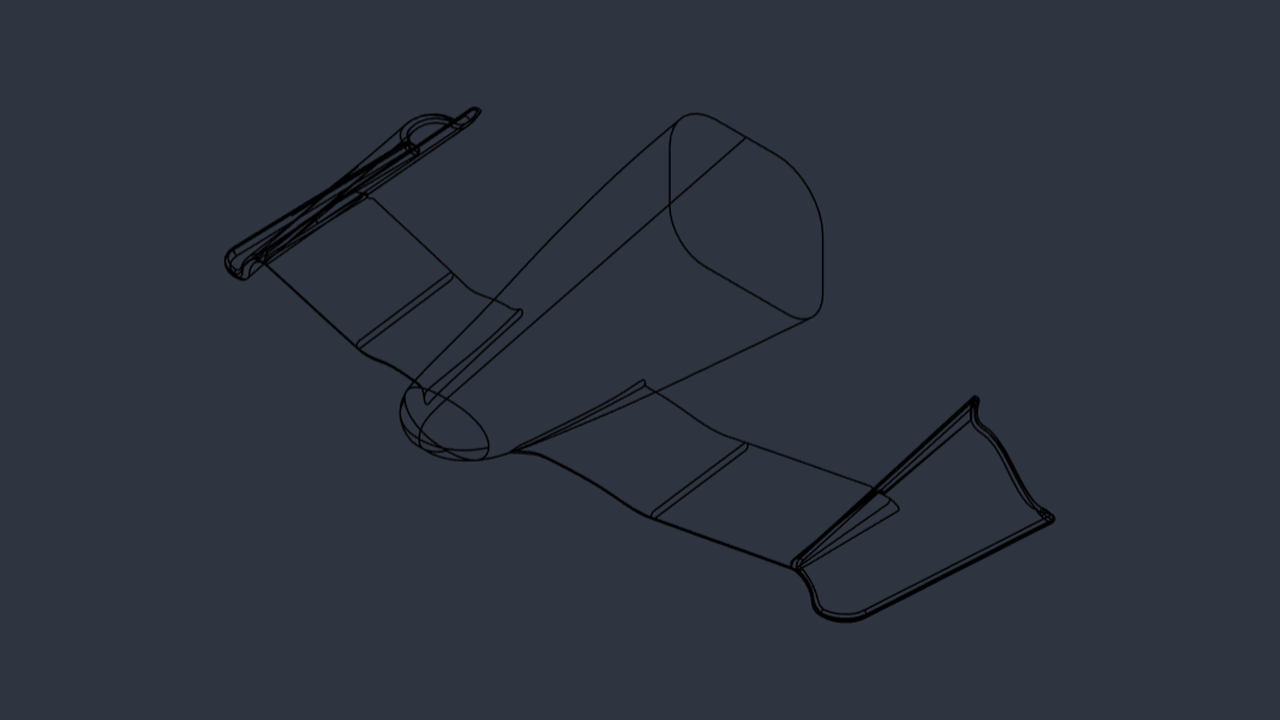
Indy Oval-Spec Front Wing
A visual reverse-engineering CAD study using limited photographs to develop a workable construction method for an underdefined piece of motorsport geometry. The model was intended as a geometric study with the possibility of later producing a display model.
The modelling challenge was to infer a workable construction method from incomplete visual reference. The finished geometry is shown here as an interactive CAD figure; the detailed methodology and limitations remain in the case-study notes below.
DRAG TO INSPECT · WHEEL / PINCH TO ZOOM
CAD CONSTRUCTION / WIREFRAME VIEW
01 / NOSE
A spline following the inferred nose curvature established the construction path; estimated intermediate profiles normal to that path were then lofted to form the nose. Closing the domed termination required additional surfacing experimentation rather than a simple solid feature.
02 / WING ELEMENT
The photographs did not expose enough section geometry to reproduce the real element, so the result is a visually coherent single-element interpretation rather than an aerodynamic or dimensionally accurate reconstruction.
03 / ENDPLATE
Intersection curves established the spanwise shape and sweep; several loft/sweep approaches were then tested before the endplate was resolved through progressively reducing semi-circular sections and a capped termination.
The main challenge was identifying what combination of curves, sections and surfaces could plausibly generate the observed geometry. With only photographs available, the construction method had to be inferred alongside the shape.
This is a CAD and geometric-interpretation study only. The profiles were not derived from aerodynamic requirements and the model is not presented as an accurate reproduction of a specific IndyCar aerodynamic surface.
MI · MECHATRONICS & INTEGRATION
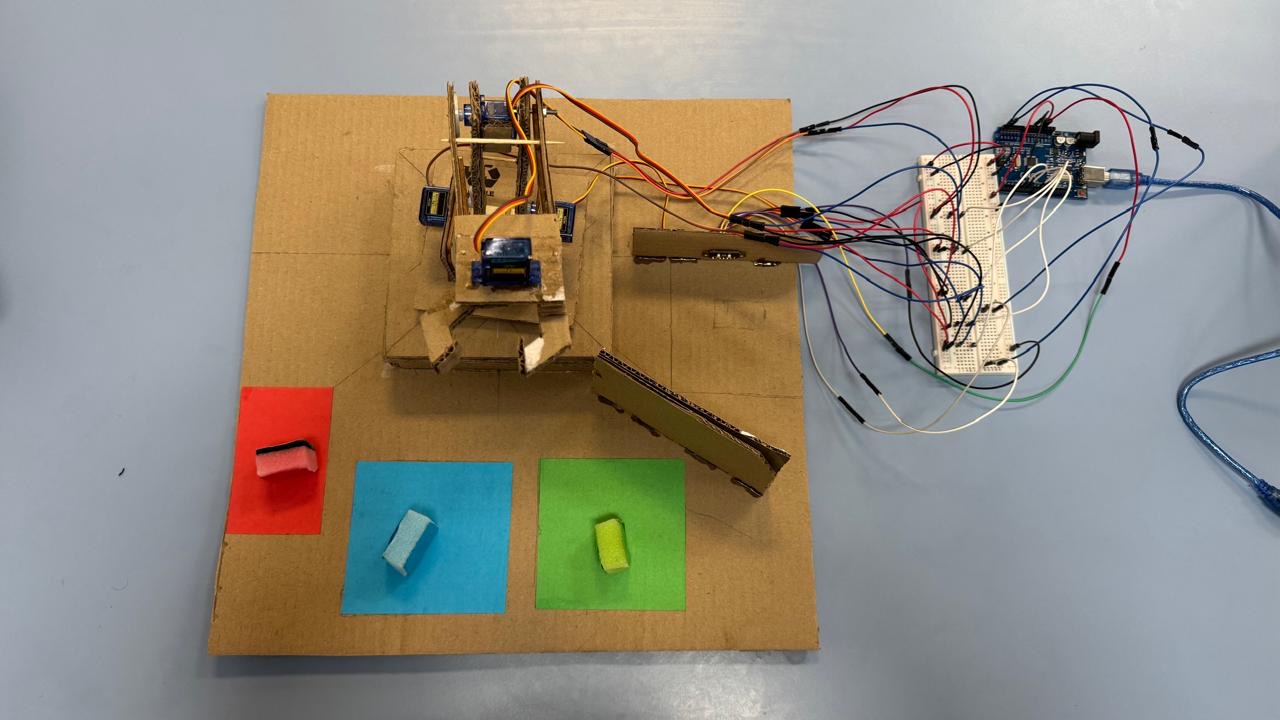
RGB Pick-and-Place Robotic Arm
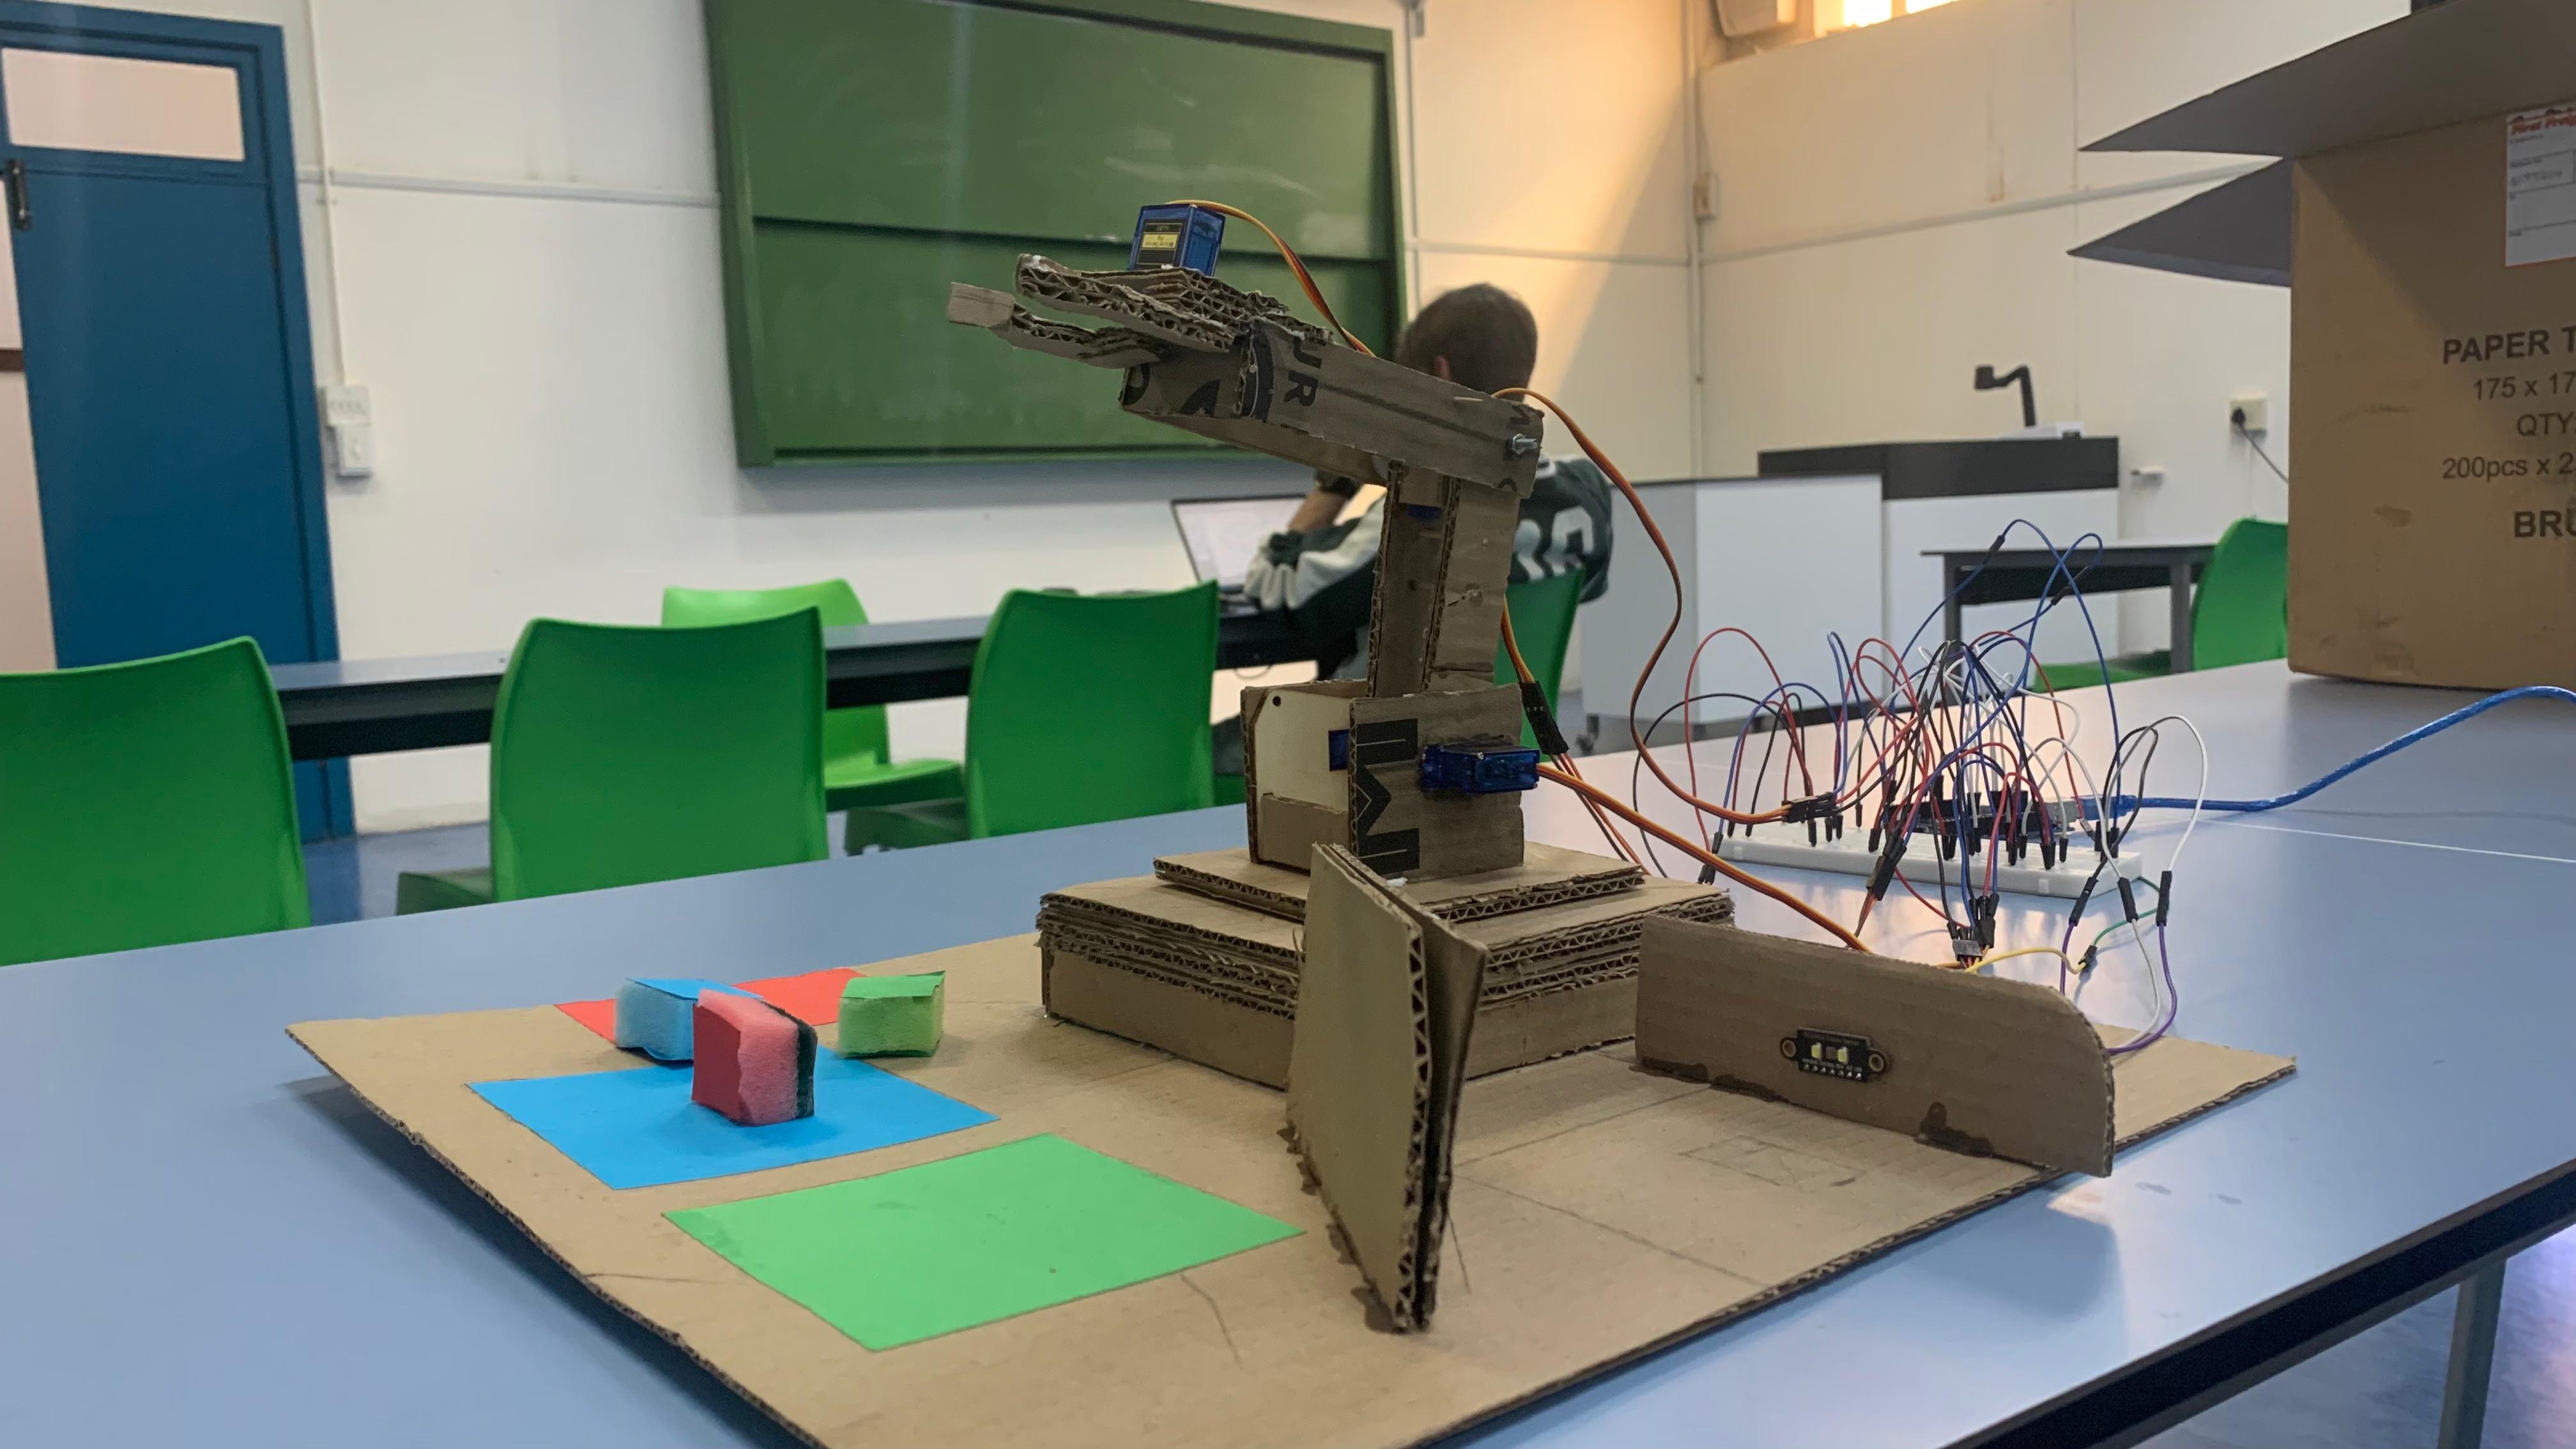
An academic mechatronics project taken from concept through physical build and control. The system combined a recycled structural material, servo actuation, colour and distance sensing, and programmed motion to sort coloured blocks.
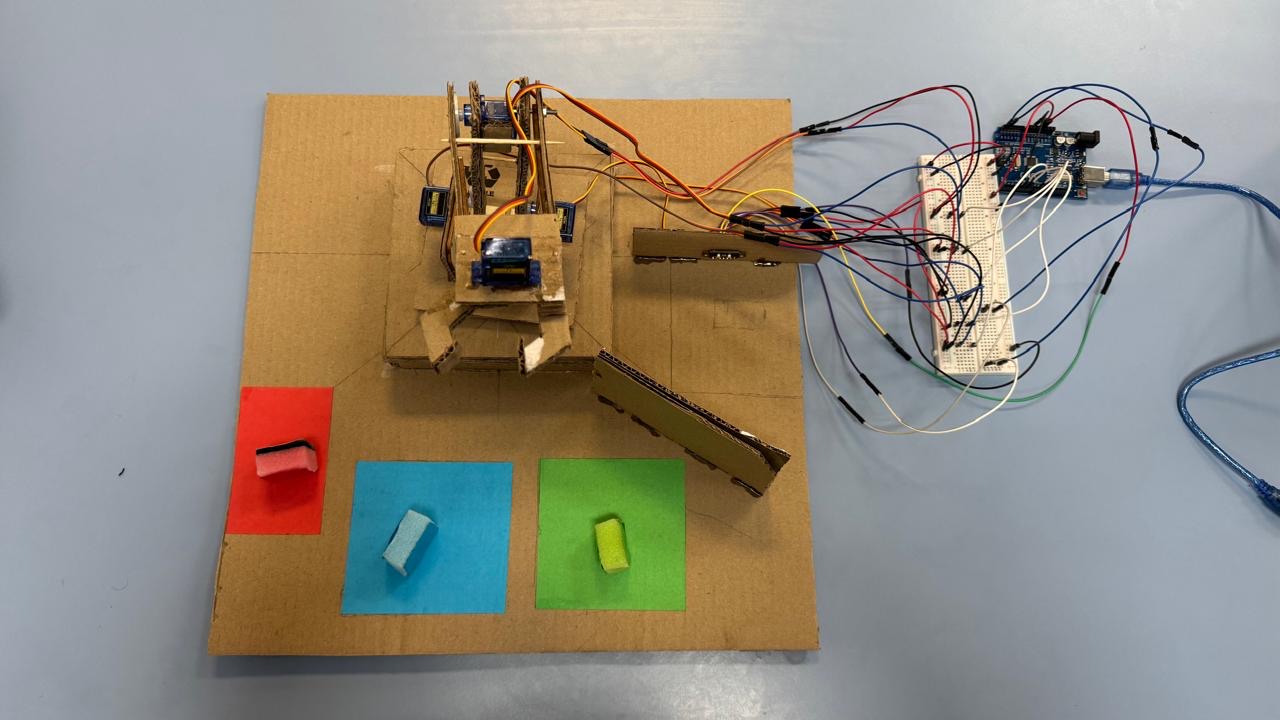
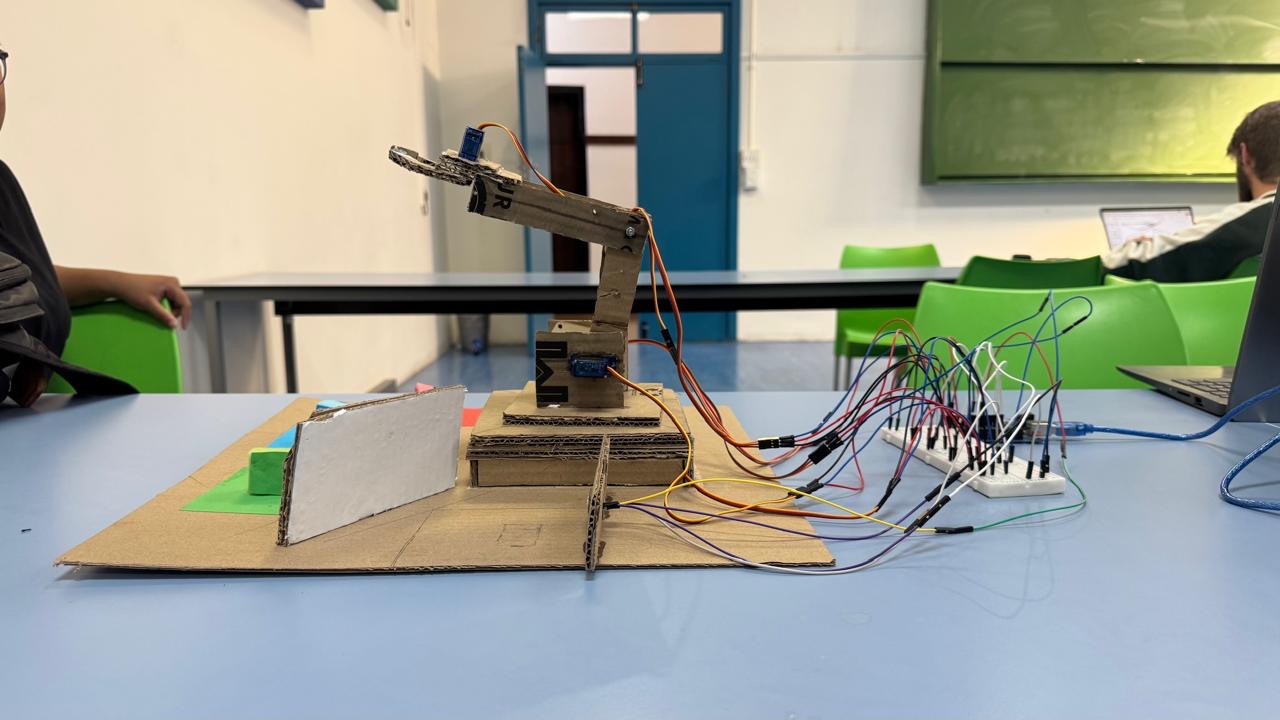
COMPLETED SYSTEM / PHYSICAL BUILDSYSTEM LAYOUT / ROBOT · TARGET ZONES · CONTROL HARDWARESTRUCTURE / ARM GEOMETRY AND ACTUATION
ENGINEERING APPROACH
The main challenge was systems integration: the mechanical structure, actuation, sensing and control had to operate as one physical system. Development began by separating the required task from capabilities that a more general robotic manipulator could provide but the brief did not require.
The operating environment used a defined detection and pickup position with fixed destination buckets. Because arbitrary target coordinates were not required, calibrated joint poses and a repeatable motion sequence matched the task; inverse kinematics would have addressed a more general problem than the brief required.
FROM MATERIAL TO MOTION
01Define the required task
02Develop the structure
03Integrate actuation & sensing
04Calibrate & test the sequence
01 / STRUCTURE
Recycled pizza-box corrugated cardboard formed much of the arm structure. It was treated as a directional structural material rather than simply packaging sheet: flute orientation was considered against the expected load path, with wooden skewers inserted as local reinforcement where additional stiffness was required.
02 / ACTUATION
Servo actuation provided the arm motion, including paired shoulder actuation within the multi-axis mechanism. The mechanical problem therefore extended beyond geometry into mounting stiffness, joint limits, repeatability and keeping the lightweight structure compatible with the available actuators.
03 / SENSING & CONTROL
An Arduino-based control system combined colour and ultrasonic sensing with the servo sequence and display hardware. RGB blocks provided the classification task; sensing established the information needed to identify the object and trigger the known pick-and-place routine.
REQUIREMENT-LED COMPLEXITY
WHY NO INVERSE KINEMATICS?
The task did not require the arm to accept arbitrary XYZ targets. Constraining pickup and placement to known locations converted a general manipulation problem into a deterministic automation problem. A calibrated sequence of joint angles matched the required function and allowed development to focus on reliable physical integration.
THE TRADE-OFF
The resulting system was intentionally task-specific rather than a general-purpose manipulator. It could repeat the defined coloured-block routine but was not designed to calculate new poses for arbitrary target locations.
INTEGRATION / WHAT THE BUILD TAUGHT
PHYSICAL INTEGRATION
Physical testing exposed interactions that are less visible in a CAD or control model: structural compliance, servo loading, mounting stiffness, wiring, shared electrical references, sensor calibration and joint repeatability all affected system behaviour.
CONTROL AS PART OF THE MECHANISM
Coordinated motion mattered more than commanding individual servos in isolation. The programmed sequence linked sensing, gripping and joint movement into one repeatable process, making the software part of the mechanism rather than a separate demonstration.
The project is presented as evidence of multidisciplinary systems integration, not advanced robotics. The fixed-location strategy used calibrated joint positions because the required task did not call for arbitrary target coordinates or a general inverse-kinematic solution.
EX · EXPERIENCE
Practical experience across manufacturing operations and motorsport.
Experience includes long-term work in a small manufacturing business and shorter motorsport placements and events. This section provides practical context for the technical projects; the CV contains the full chronology.
2019–2025 · Johannesburg, South Africa
Biopack Sustainable Packaging
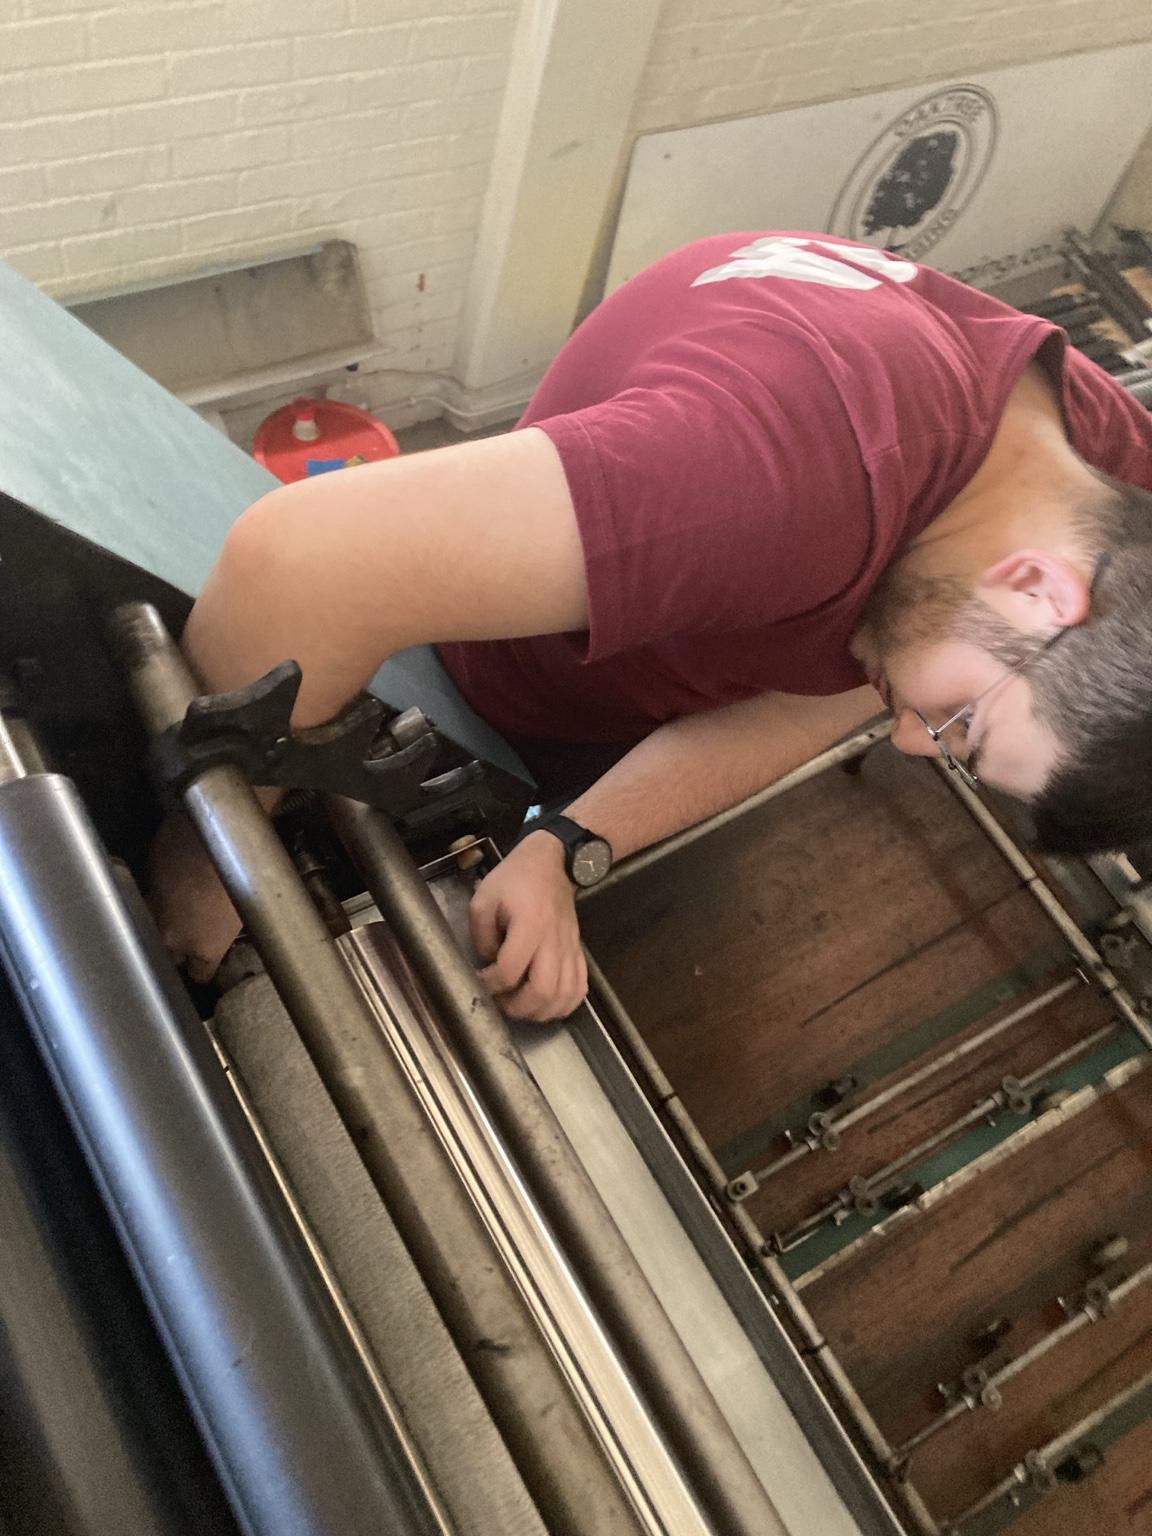
Six years in a family-run manufacturing business across production, administration and logistics. During the later years, responsibility expanded into day-to-day operations alongside practical manufacturing work.
Machine setup and product changeovers, production troubleshooting, stock handling, delivery support and day-to-day production work.
Operations & responsibility
Later responsibilities included administration, production coordination, inventory, deliveries and staff supervision.
A packaging concept was also developed through trial manufacture and market evaluation, providing direct product-development experience within the manufacturing role.
MANUFACTURINGOPERATIONSTROUBLESHOOTINGPRODUCT DEVELOPMENT
Kyalami, South Africa · Motorsport experience
NGK Pablo Clark Racing
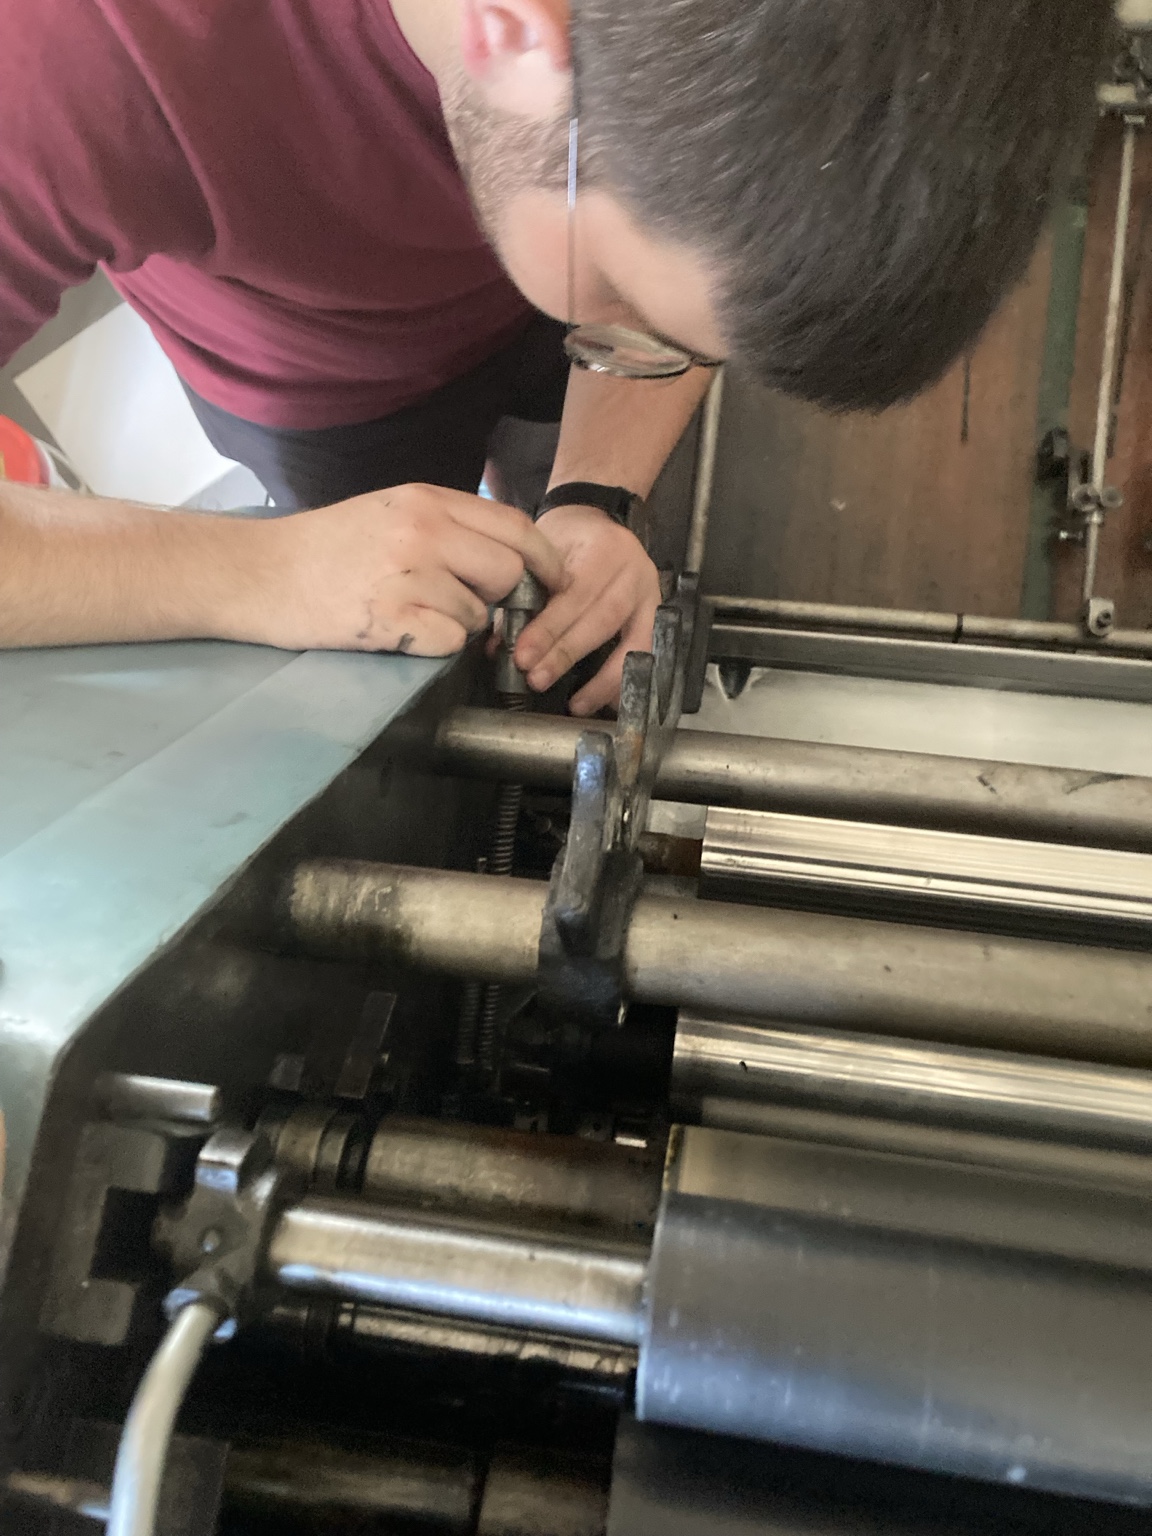
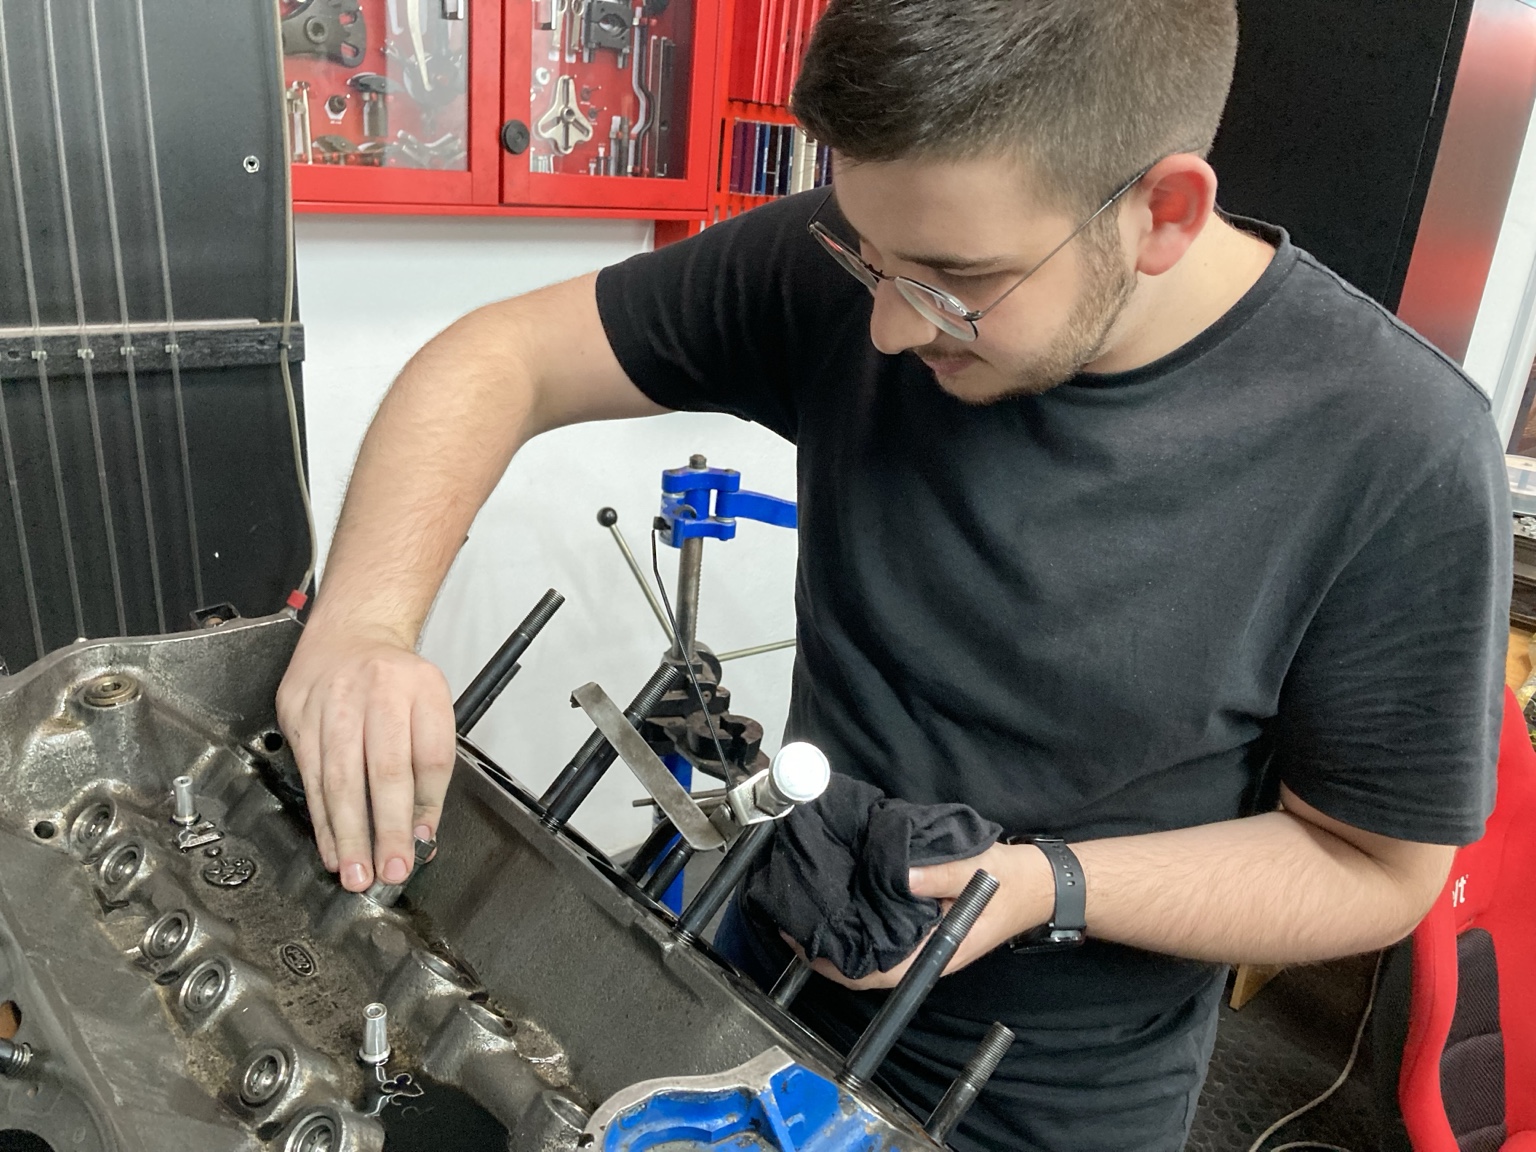
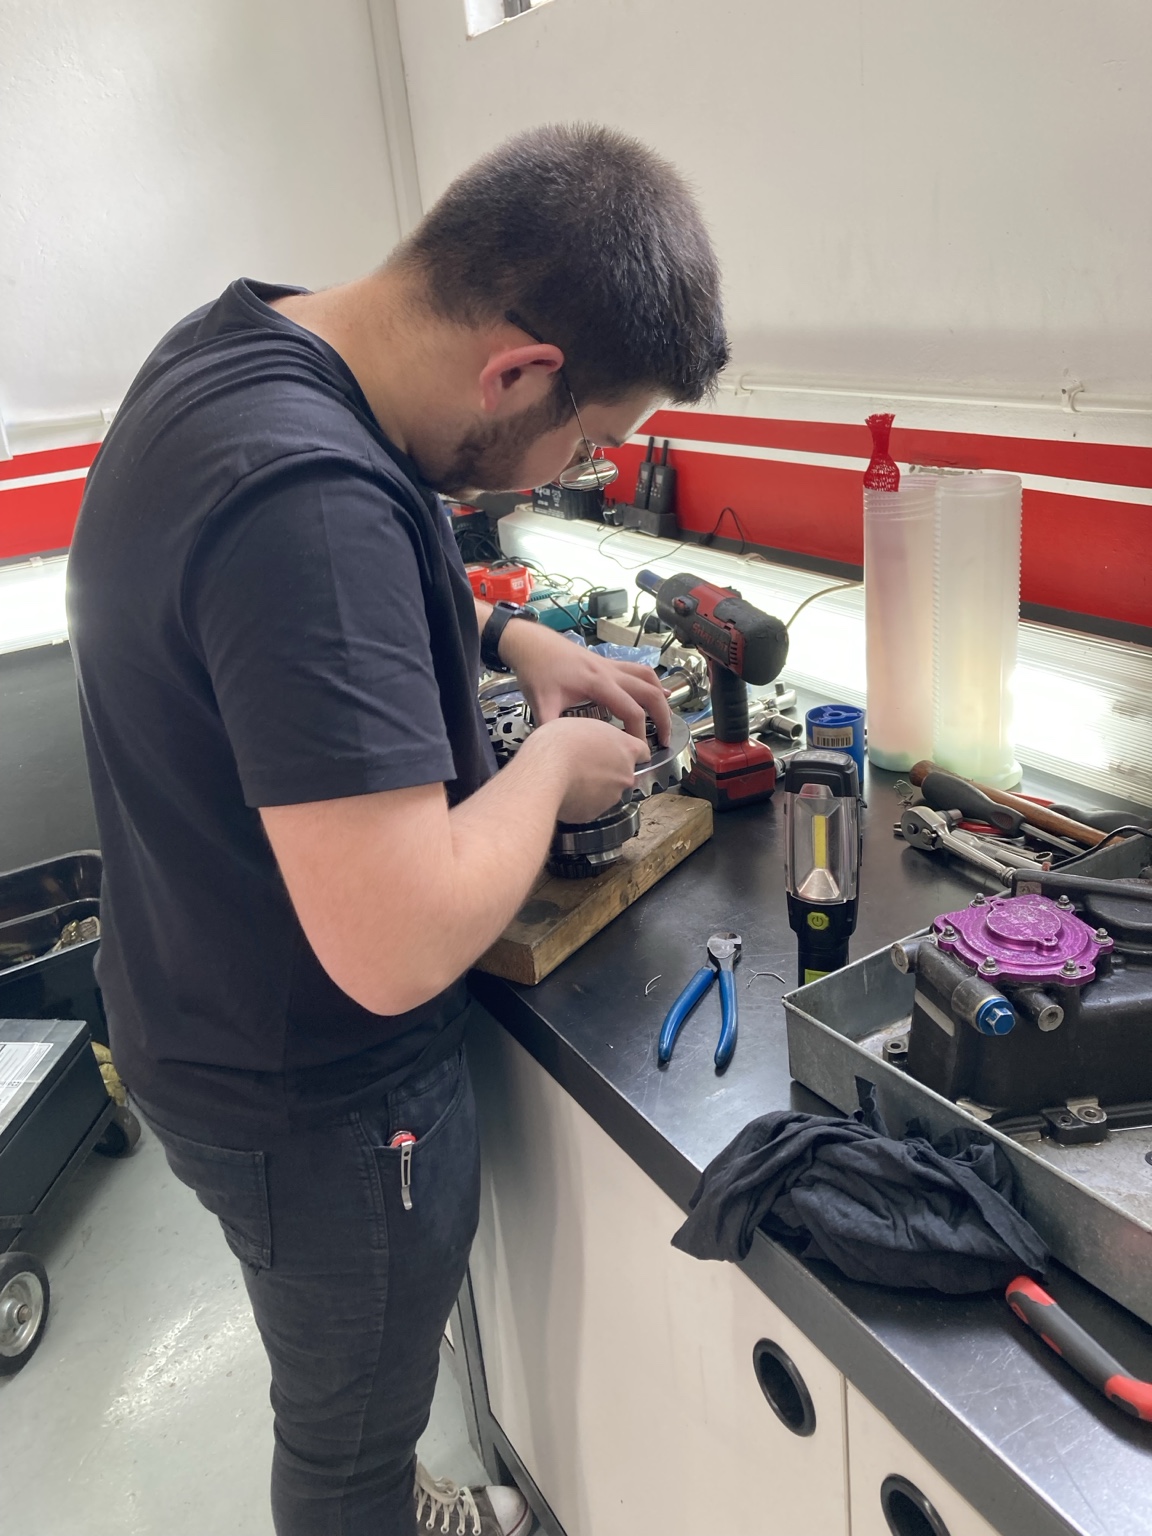
Motorsport experience comprised two separate activities: a three-week engineering internship in a race-shop and trackside environment, followed by several corporate simulator-event weekends.
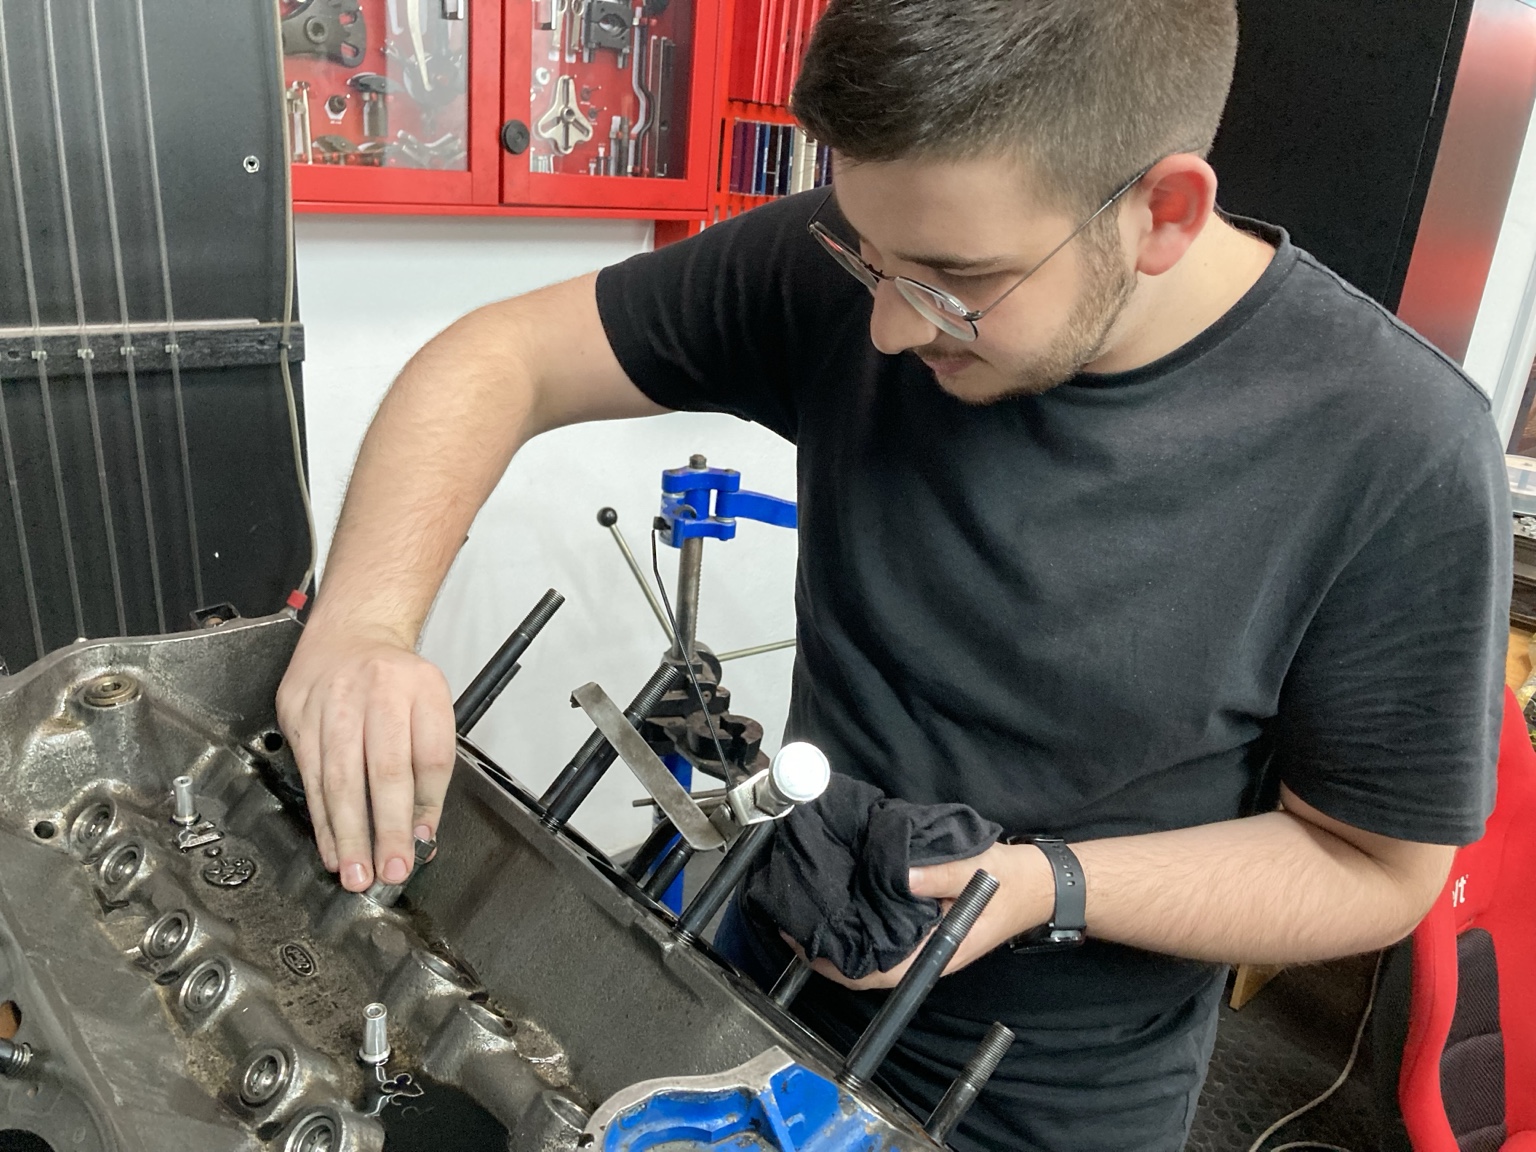
Workshop, race-preparation and trackside exposure included setup and alignment, tyre monitoring, mechanical diagnosis, engine, gearbox and differential work, dynamometer testing, fabrication and motorsport safety systems.
Simulator events · ~3 weekends
Corporate simulator-event work included operating an open-wheel simulator, managing participant runs and timing, and providing informal driving guidance where users wanted help with confidence or lap-time improvement.
The internship also included iterative modification of a professional driver-training simulator to reproduce Ferrari Daytona Competizione cockpit ergonomics for Le Mans Classic preparation, followed by support during driver training.
RACE SHOPTRACKSIDESIMULATORDRIVER SUPPORT
PORTFOLIO / DEVELOPMENT NOTE
Engineering decisions, demonstrated through the work.
Across the projects, the recurring process is to establish the available information, data and resources; define what the problem actually requires; and select an engineering method appropriate to the required accuracy and available evidence. Model fidelity and technical complexity are increased where the requirement, validation evidence or observed limitations justify them. The case studies therefore focus on constraints, engineering decisions, trade-offs and validation rather than complexity as an end in itself.